As part of my research into the Harlow post-war collections and new town legacy, I’ve been looking at some of the statistical data used to track the growth of the new town economy (population, houses, jobs etc). Collection of statistics was an important element of managing growth and anticipating change for the Harlow Development Corporation right from the beginning, with greater sophistication of analysis developing over time.
An early, rather ‘rough and ready’ analysis of the new town’s demographic make-up likened the age structure of Harlow ‘to that of a developing country’, 20% of the population were under 5, 40% were under 15. These were easy-to-digest figures that chimed with the Daily Mirror moniker for Harlow at that time, ‘pram town’.
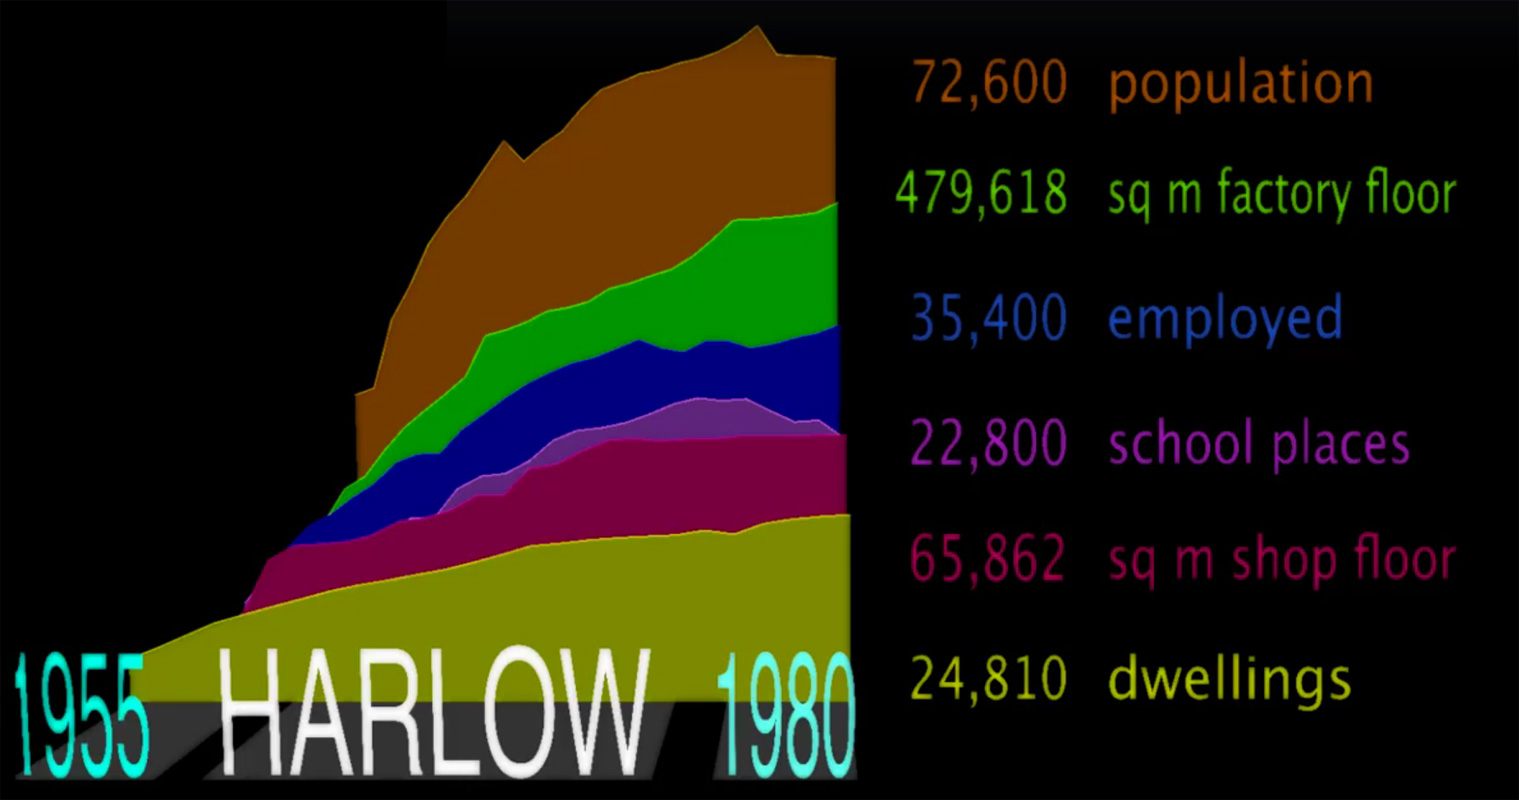
Taking a step back from the detail, a couple of things strike me, firstly the sheer scale and quantity of data that was collected and remains available to this day, for example at Harlow Museum. Secondly, the entirely visceral speed of urban growth that these statistics bear witness to: in terms of houses built, school places fulfilled, square metres of shop and factory floors created etc.
I’ve been playing around with a selection of the key indicators to see what they look like when plotted side-by-side over time, an infographic if you like. Data and quotes taken from “Harlow: The Story of a New Town” by Gibberd, Harvey, White and others.